Series: Inside EKS Networking · Post 2 of 7 · ~35 min read
How a packet travels from pod to pod without a tunnel, why Kubernetes Services have no process listening on their IP, and the three dataplane models that sit between your ALB and your application.
A single packet leaves Pod A.
It will cross five distinct routing decisions before it reaches Pod B. It will pass through two network namespaces, a policy routing table, a VPC route table, and another policy routing table on the far side. At no point will it be wrapped in an outer header. The VPC sees the real pod IPs on every hop.
Then we’ll send the same packet to a Kubernetes Service. That path looks completely different. The ClusterIP the sender is targeting has no process behind it, no ARP entry, no route. The IP only exists in thousands of iptables rules that rewrite the destination before the packet ever touches the network. At 10,000 services those rules become measurable overhead. At 100,000 they become a crisis.
Then we’ll watch an ALB decide whether to route to a pod directly or to a node first — a decision with real consequences for source IP visibility, extra hops, and what happens when a pod terminates mid-connection.
Post 1 covered how pods get their addresses and how ipamd manages the warm pool. This post follows what happens after. The packet has an IP. Now it needs to travel.
Section 1 — Node to node: how a packet crosses AWS without a tunnel
The setup Every pod-to-pod conversation in EKS starts the same way — a packet leaves a pod’s network namespace and needs to reach another pod on a completely different EC2 instance. No tunnel. No encapsulation. No overlay. Just a packet with real IPs travelling through the VPC the same way any EC2 traffic does.
This section follows that packet from the moment it leaves Pod A on Node 1 to the moment it arrives at Pod D on Node 2. Every hop is observable. Every decision has a command you can run to verify it.
Before we trace the path, two things need to be understood about how EKS makes this possible — the VPC routing table and source/dest check. Get these wrong and traffic fails silently in ways that look like application bugs.
The VPC routing table When the VPC CNI attaches an ENI, it writes a route in the VPC route table — one entry per node, pointing to its primary ENI. Every pod IP is a real secondary IP on that ENI, so the VPC already knows where every pod lives. No tunnel required.
In a VXLAN overlay, pod packets are wrapped in outer UDP frames carrying node IPs. The VPC sees node-to-node UDP — pod IPs are completely invisible to it. On EKS the VPC sees 10.0.1.11 → 10.0.2.20 directly. Flow Logs record real pod IPs. Security groups target individual pods. Nothing is hidden.
Source/dest check By default EC2 drops any packet whose source IP doesn’t belong to the sending ENI — this stops instances acting as routers. For pod traffic this would be fatal. EKS disables it automatically on every ENI at attachment time. You never touch it.
The full hop-by-hop path
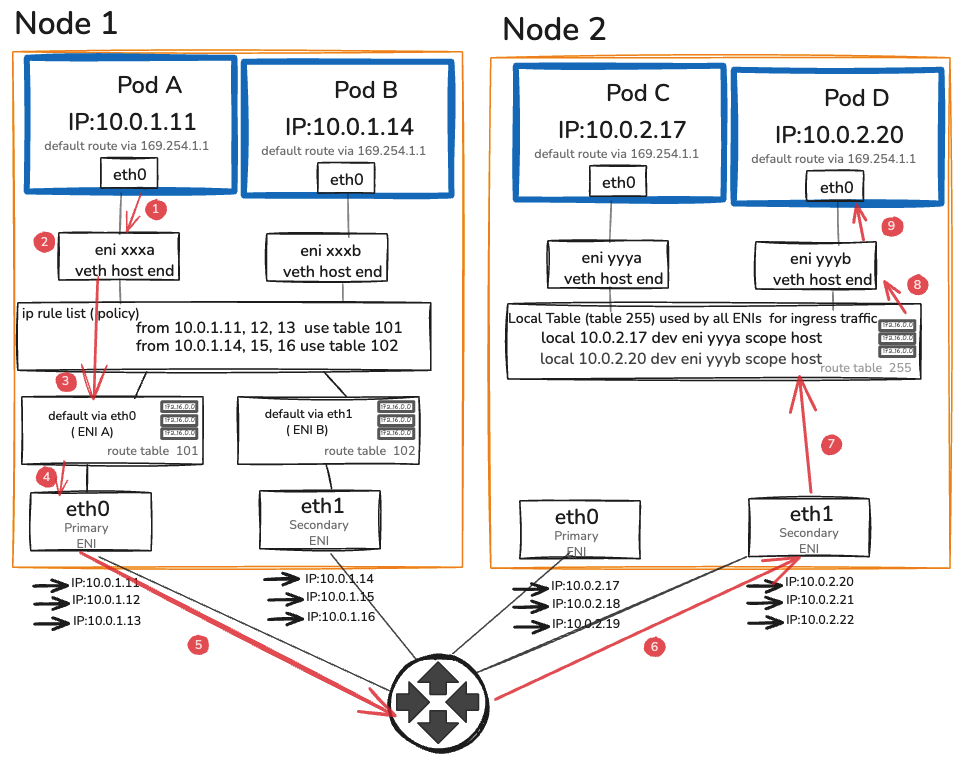
Here is every step a packet takes from Pod A on Node 1 to Pod B on Node 2. Each step is a decision point. Each one is observable.
- Step 1 — Pod A eth0 Sends packet. Only route: default via 169.254.1.1. Proxy ARP on eni xxxa answers. Packet leaves Pod A’s eth0.
- Step 2 — veth → eni xxxa Enters host namespace. Headers unchanged — src: 10.0.1.11 · dst: 10.0.2.20.
- Step 3 — ip rule list from 10.0.1.11 → table 101. Table 101: default via eth0. Packet exits primary ENI.
- Step 4 — eth0 → VPC Source/dest check OFF. VPC route: 10.0.2.x → Node 2 eth1. No tunnel. No NAT.
- Step 5 — VPC → Node 2 eth1 Arrives at secondary ENI — eth1 owns the 10.0.2.20 pool.
- Step 6 — local table (table 255) ip rule skipped — ingress only uses dst lookup. Finds: local 10.0.2.20 dev eni yyyb.
- Step 7 — eni yyyb → veth Delivered to Pod D’s veth host-end. Crosses into pod namespace.
- Step 8 — Pod D eth0 Receives packet. src: 10.0.1.11 intact. Zero tunnels. Zero NAT.
Six steps. Zero tunnels. Zero overhead from encapsulation or decapsulation.
Section 2 — Services, kube-proxy, and the iptables chain nobody reads
In Section 1 we followed a packet from Pod A directly to Pod D using real pod IPs. That works when you know exactly which pod you want to talk to. In practice you never do.
Pods are ephemeral. They restart, reschedule, and scale up and down constantly. Their IPs change every time. Hardcoding a pod IP in your application is the same as hardcoding a phone number that changes every deployment.
Kubernetes solves this with Services. A Service gives you a stable virtual IP — the ClusterIP — that never changes regardless of what happens to the pods behind it. Your application talks to the ClusterIP. Kubernetes figures out which pod to send it to.
The interesting question is how. Because a ClusterIP is not a real address. No process listens on it. No EC2 instance owns it. It has no route and no ARP entry. If you try to ping one right now it disappears into silence.
The ClusterIP problem
Run this on any EKS node:
# Pick a service
kubectl get svc kubernetes -o jsonpath='{.spec.clusterIP}'
# 172.20.0.1

# Try to ping it
ping 172.20.0.1
# Packets sent. No replies. Not because it's blocked --
# because nothing on the network knows where 172.20.0.1 lives.

# Look for a route
ip route get 172.20.0.1
# RTNETLINK answers: Network is unreachable
# (or: via 169.254.1.1 dev eth0 -- the default route. No specific entry.)

# Look for an ARP entry
arp -n | grep 172.20.0.1
# Nothing.
A ClusterIP has no route. No ARP entry. No process listening on it. No EC2 instance owns it. It is a virtual address that exists only in iptables rules — and those rules are what intercepts traffic before the routing table ever sees the destination.
This is the fundamental mechanic behind Kubernetes Services, and understanding it changes how you read every networking problem involving Services.
The chain anatomy
When a pod sends a packet to a ClusterIP, the packet enters the PREROUTING chain before the routing table makes any decision about where to send it. kube-proxy has installed rules in PREROUTING that jump to its own chains. Here is the complete path for a packet destined for a service with two endpoints:
PREROUTING
└─→ KUBE-SERVICES
└─→ KUBE-SVC-XXXXXXXXXXXXXX (matches this service’s ClusterIP:port)
├─→ KUBE-SEP-AAAAAAAAAA (50% probability — endpoint 1)
│ └─→ DNAT to 10.0.1.11:8080
└─→ KUBE-SEP-BBBBBBBBBB (50% probability — endpoint 2)
└─→ DNAT to 10.0.2.16:8080
Walk through this with a live cluster:
# List the KUBE-SERVICES chain — one entry per service
sudo iptables -t nat -L KUBE-SERVICES -n –line-numbers | head -30
# Find your service’s chain
SVC_CHAIN=$(sudo iptables -t nat -L KUBE-SERVICES -n \
| grep “10.100.50.23” \ # your service’s ClusterIP
| awk ‘{print $2}’)
# Walk into it
sudo iptables -t nat -L $SVC_CHAIN -n -v
# You’ll see something like:
# Chain KUBE-SVC-XXXXXX (1 references)
# pkts bytes target prot source destination
# 0 0 KUBE-SEP-AAAAAAAAAAAAA all 0.0.0.0/0 0.0.0.0/0 statistic mode random probability 0.50000000000
# 0 0 KUBE-SEP-BBBBBBBBBBBBB all 0.0.0.0/0 0.0.0.0/0
# Walk into one SEP chain
sudo iptables -t nat -L KUBE-SEP-AAAAAAAAAAAAA -n -v
# Chain KUBE-SEP-AAAAAAAAAAAAA (1 references)
# pkts bytes target prot source destination
# 0 0 DNAT tcp 0.0.0.0/0 0.0.0.0/0 tcp to:10.0.1.11:8080
The DNAT rule rewrites the destination from the ClusterIP (10.100.50.23:80) to the pod IP (10.0.1.11:8080) before the packet hits the routing table. The routing table then routes it as a normal pod-to-pod packet. After DNAT, the path is identical to Section 1 — the packet travels node to node with the real pod IP as the destination.
The connection tracking table records the original connection (source, ClusterIP:port) and the translated destination (source, podIP:port). Return traffic is un-DNATted automatically by conntrack. The sender never sees the pod IP — it sees replies from the ClusterIP throughout the connection lifetime.
The O(n) rule traversal problem
iptables evaluates rules linearly. A packet destined for service #5,000 traverses the first 4,999 entries in KUBE-SERVICES before reaching the right chain. The average traversal per packet is n/2 rules, where n is the number of services.
The numbers at scale:
Services | Rules (approx) | Avg traversal per packet |
100 | ~2,000 | ~1,000 |
1,000 | ~20,000 | ~10,000 |
10,000 | ~200,000 | ~100,000 |
Each rule evaluation is a kernel operation. At 100 services the overhead is invisible. At 10,000 services, every packet to any ClusterIP traverses 100,000 iptables rules. On a busy node with thousands of service calls per second, the cumulative CPU cost becomes measurable — typically 5–15% of a core per 10,000 services under moderate load, benchmarked on m5.xlarge.
The second problem is update cost. Every time a pod is added or removed — a rolling deployment, a scale event, a node failure — kube-proxy rewrites the entire iptables ruleset. This is not an incremental update. iptables holds a single kernel-level lock during the write. Every packet traversal that arrives during the update waits. On a cluster with 1,000 services and a rapid rolling deploy touching 50 pods, the lock is held for 50–200ms per update cycle. Under high request rate, this produces latency spikes that are difficult to attribute — they appear as periodic p99 blips with no application-level explanation.
# Measure iptables rule count on a live node
sudo iptables -t nat -L | wc -l
# Measure update time during a rolling deploy
# On a separate terminal, while watching a rolling deploy:
time sudo iptables-save > /dev/null
# This exercises the same lock path as kube-proxy’s write cycle.
# On a cluster with 500+ services, this takes 50–300ms.
IPVS mode
IPVS (IP Virtual Server) replaces the linear iptables chains with a kernel hash table. Instead of traversing 100,000 rules, service lookup is O(1) — the kernel computes a hash of the destination IP:port and returns the endpoint directly.
The update model is also fundamentally different. IPVS supports incremental updates: adding or removing a single endpoint touches only that endpoint’s entry, not the entire ruleset. There is no global lock hold during an update. Rolling deploys at scale no longer produce lock-contention latency spikes.
Switching to IPVS mode
IPVS requires kernel modules that are present on EKS AMIs but not loaded by default:
# Verify modules are available (run on a node)
lsmod | grep -E ‘ip_vs|nf_conntrack’
# If not loaded, load them
sudo modprobe ip_vs
sudo modprobe ip_vs_rr
sudo modprobe ip_vs_wrr
sudo modprobe ip_vs_sh
sudo modprobe nf_conntrack
# Make persistent across reboots
cat < ip_vs ip_vs_rr ip_vs_wrr ip_vs_sh nf_conntrack EOF To switch kube-proxy to IPVS mode, edit the kube-proxy ConfigMap: kubectl edit configmap kube-proxy -n kube-system # Find the mode field and change it: # mode: “ipvs” # Also set: # ipvs: # scheduler: “rr” # round-robin; alternatives: wrr, sh (source-hash) # Restart kube-proxy to pick up the change kubectl rollout restart daemonset kube-proxy -n kube-system Verify IPVS is active: # Install ipvsadm on the node sudo yum install -y ipvsadm # Amazon Linux 2 # or: sudo apt-get install ipvsadm # Ubuntu # List virtual services sudo ipvsadm -Ln # IP Virtual Server version 1.2.1 (size=4096) # Prot LocalAddress:Port Scheduler Flags # -> RemoteAddress:Port Forward Weight ActiveConn InActConn # TCP 172.20.0.1:443 rr # -> 10.0.1.5:443 Masq 1 0 0 # TCP 10.100.50.23:80 rr # -> 10.0.1.11:8080 Masq 1 0 0 # -> 10.0.2.16:8080 Masq 1 0 0 # Count virtual services sudo ipvsadm -Ln | grep -c “^TCP\|^UDP” # One entry per service — hash table, not a chain The iptables chain for 10,000 services is gone. In its place: a hash table with 10,000 entries, each looked up in constant time. Performance comparison — approximate numbers on m5.xlarge at 5,000 req/s: Mode p50 latency p99 latency CPU overhead (service processing) iptables +0.3ms +2.1ms ~8% of one core IPVS +0.05ms +0.2ms ~0.5% of one core These numbers scale with service count. At 100 services the difference is invisible. At 5,000 services it’s the difference between a stable p99 and a jittery one. IPVS improves on iptables significantly. eBPF goes further: it removes the service translation layer from the packet path entirely. kube-proxy, in both iptables and IPVS mode, operates at the network layer. By the time its rules run, the kernel has already built the packet: IP header, TCP header, payload. The rule rewrites the destination IP in that already-built packet. The kernel then re-evaluates routing, updates conntrack, and sends the packet on its way. Cilium’s kube-proxy replacement operates at the socket layer — before the packet is built. When a process calls connect() to a ClusterIP, Cilium’s eBPF program intercepts that syscall and rewrites the destination to the actual backend IP before the kernel builds the packet. The socket is connected directly to the pod IP from the start. There is no DNAT. No conntrack entry for the service translation. No packet rewrite. The practical consequence: for pod-to-pod traffic through a Service, Cilium eliminates an entire pass through the kernel networking stack compared to iptables, and nearly matches raw pod-to-pod latency. Cilium attaches eBPF programs at two points in the kernel: Traffic Control (TC) layer — for packets that have already been built (external traffic, NodePort, traffic from non-eBPF-aware sockets). TC programs run after the network device driver but before routing. Cilium’s TC program handles cases the socket layer can’t intercept — incoming traffic from outside the cluster, for instance. Socket operations (sockops/sk_msg) — for local pod-to-pod traffic through Services. When a pod’s process opens a socket and calls connect() to a ClusterIP, the sockops eBPF hook fires. Cilium looks up the ClusterIP in its service map (a BPF hash map in kernel memory), selects a backend using its load balancing algorithm, and rewrites the connect destination directly. The packet that eventually leaves the socket already has the pod IP as the destination. No iptables. No conntrack for the translation. At 10,000 services on m5.xlarge, sustained 10,000 req/s: Mode p50 p99 CPU (svc overhead) Update time (1 endpoint change) iptables +0.4ms +3.2ms ~12% one core 150–400ms (full ruleset rewrite) IPVS +0.1ms +0.4ms ~1% one core <5ms (incremental) eBPF +0.02ms +0.08ms ~0.1% one core <1ms (BPF map update) The eBPF numbers are close to the overhead of a raw pod-to-pod connection with no service in the path. That’s because at the socket layer, there effectively isn’t one. Switching to Cilium as a kube-proxy replacement changes your operational model. iptables -L no longer shows service rules. The service state lives in BPF maps. Inspect it with: # List Cilium’s service table cilium service list # Inspect a specific service cilium service get # BPF map directly bpftool map dump name cilium_lb4_services_v2 Standard kube-proxy tooling doesn’t apply. sudo ipvsadm -Ln returns nothing. Your runbooks, dashboards, and debugging habits built around iptables need to be rebuilt around Cilium’s tooling. Hubble — Cilium’s observability layer — partially compensates for this. It provides flow-level visibility (which pod talked to which service, which connections were dropped by policy, L7 HTTP request/response visibility) that iptables and IPVS can’t match. But it requires deploying and operating Hubble, which is another system to maintain. You don’t have to replace the VPC CNI to get Cilium’s kube-proxy replacement. Cilium can run in chained CNI mode: the VPC CNI handles IPAM (pods still get real VPC IPs), and Cilium runs as a chained plugin that adds its eBPF service translation and network policy enforcement on top. This gives you the VPC CNI’s IP address model (real VPC IPs, Flow Logs, ALB IP mode compatibility) plus Cilium’s service performance and network policy enforcement — without migrating to Cilium’s own IPAM. The full replacement path — Cilium as both CNI and kube-proxy replacement — is more operationally complex and takes you further from the EKS standard support path. For most teams, chained mode is the right starting point. The ALB sits outside your cluster entirely. It doesn’t speak Kubernetes. It speaks IP addresses and health checks. How traffic flows from the ALB to your pods depends on which mode the ALB controller uses — and the two modes have fundamentally different dataplanes. In instance mode, the ALB registers EC2 instance IDs as targets. When traffic arrives for a target, the ALB sends it to the node on a NodePort — a high-numbered port (30000–32767) that kube-proxy has opened on every node. The packet arrives at the node’s primary ENI on the NodePort, enters the host namespace, gets DNAT’d by kube-proxy to a pod IP (on this node or another), and travels the normal pod-to-pod path from there. The flow: Client → ALB → Node:NodePort → kube-proxy DNAT → Pod Three things happen in instance mode that don’t happen in IP mode: 1. The source IP is lost. When the packet arrives at the node from the ALB, the node performs SNAT — it replaces the client’s source IP with the node’s IP before forwarding to the pod. The pod sees the node IP as the source, not the client’s IP. The ALB does set X-Forwarded-For with the real client IP, but that header is only visible to the application if it reads it explicitly. 2. Traffic can be double-hopped. kube-proxy’s DNAT at the NodePort selects any available endpoint for the service — including pods on other nodes. A packet can arrive at Node A from the ALB, get forwarded by kube-proxy to a pod on Node B, and then travel the full cross-node path. You’re paying for an extra network hop that the ALB could have avoided if it knew where the pods were. 3. externalTrafficPolicy: Local partially fixes both. Setting this on your Service tells kube-proxy to only forward NodePort traffic to pods on the same node. Source IP is preserved (no SNAT needed when forwarding locally). The double-hop is eliminated. The cost: if a node has no healthy pods for this service, the ALB’s health check to that node fails and it stops sending traffic there. The ALB load balances unevenly across nodes because not all nodes have pods. You’re trading even load distribution for source IP and reduced hops. apiVersion: v1 kind: Service metadata: name: my-service spec: type: NodePort externalTrafficPolicy: Local # preserve source IP, no cross-node hop selector: app: my-app ports: – port: 80 targetPort: 8080 In IP mode, the ALB registers pod IPs directly as targets. When a new pod becomes ready, the ALB controller calls the EC2 API to register that pod’s IP (and port) in the target group. Traffic from the ALB goes directly to the pod’s ENI — no NodePort, no kube-proxy, no extra hop. The flow: Client → ALB → Pod ENI (direct) IP mode requires the VPC CNI. The ALB targets pod IPs directly, which must be real VPC IPs reachable by the ALB. An overlay CNI with private pod IPs can’t be targeted in IP mode — the ALB has no route to addresses that don’t exist in the VPC. IP mode preserves source IP. Because traffic goes directly to the pod without NAT at the node, the pod sees the ALB’s IP as the source (not the client’s IP — the ALB terminates the connection, so you still read X-Forwarded-For for the real client IP). No SNAT. No node in the data path. IP mode also enables connection draining at the pod level. When a pod is deleted, the ALB controller deregisters the pod IP from the target group, and the ALB begins its deregistration delay — holding existing connections open until they complete or the delay expires, while sending no new connections to that target. Instance mode can’t offer this granularity — it deregisters at the node level, which may still have other pods running. The AWS Load Balancer Controller (LBC) watches Kubernetes Ingress and Service objects. When it detects a change — a new Ingress, an annotation update, a pod becoming Ready or NotReady — it reconciles the desired state against the actual ALB configuration via the EC2 and ELBv2 APIs. The reconciliation loop runs continuously, but API calls are rate-limited. A large cluster with many rapid pod churn events can hit ELBv2 API rate limits during mass deployments, causing target group updates to queue. This is the root cause of target registration lag — pods are Ready in Kubernetes, but the ALB hasn’t registered them yet because the controller’s API calls are backed up. The annotation model is the LBC’s biggest operational pain point. Every meaningful ALB configuration — scheme, target type, health check path, SSL policy, WAF ARN, security groups — lives in annotations on the Ingress object: annotations: kubernetes.io/ingress.class: alb alb.ingress.kubernetes.io/scheme: internet-facing alb.ingress.kubernetes.io/target-type: ip # IP mode alb.ingress.kubernetes.io/healthcheck-path: /healthz alb.ingress.kubernetes.io/healthcheck-interval-seconds: “15” alb.ingress.kubernetes.io/ssl-policy: ELBSecurityPolicy-TLS13-1-2-2021-06 alb.ingress.kubernetes.io/wafv2-acl-arn: arn:aws:wafv2:… alb.ingress.kubernetes.io/security-groups: sg-0123456789abcdef0 Annotation errors fail silently. A typo in an annotation name is not a validation error — the LBC ignores unknown annotations. Your WAF isn’t attached. Your custom security group wasn’t applied. The ALB came up with defaults, and you may not notice until an audit or an incident. # Check LBC reconciliation logs for errors kubectl logs -n kube-system \ -l app.kubernetes.io/name=aws-load-balancer-controller \ –tail=100 | grep -iE ‘error|failed|reconcil’ # Check events on the Ingress object kubectl describe ingress my-ingress | grep -A20 Events Gateway API is the successor to Ingress. Where Ingress puts all configuration in annotations on a single object, Gateway API splits responsibilities across three distinct resource types. GatewayClass — cluster-scoped, defines the controller implementation. Created once per controller type: apiVersion: gateway.networking.k8s.io/v1 kind: GatewayClass metadata: name: aws-alb spec: controllerName: eks.amazonaws.com/alb Gateway — namespace-scoped (or cluster-scoped), defines the load balancer configuration: listeners, ports, TLS, scheme: apiVersion: gateway.networking.k8s.io/v1 kind: Gateway metadata: name: production-gateway namespace: infra spec: gatewayClassName: aws-alb listeners: – name: https port: 443 protocol: HTTPS tls: certificateRefs: – name: my-cert HTTPRoute — namespace-scoped, defines routing rules. Multiple teams can create HTTPRoutes that attach to the same Gateway without touching each other’s objects: apiVersion: gateway.networking.k8s.io/v1 kind: HTTPRoute metadata: name: payments-route namespace: payments spec: parentRefs: – name: production-gateway namespace: infra rules: – matches: – path: type: PathPrefix value: /payments backendRefs: – name: payments-service port: 8080 weight: 90 # weighted traffic split — canary or blue/green – name: payments-service-canary port: 8080 weight: 10 The weighted backendRefs in HTTPRoute give you canary deployments natively — no annotation hacks, no separate ingress controller configuration. Point 10% of traffic to the canary, validate, shift to 50%, validate, shift to 100%. Ingress can’t express this without controller-specific annotations that vary by implementation. Header-based routing — send traffic with X-Beta-User: true to a different backend — is a first-class HTTPRoute feature: rules: – matches: – headers: – name: X-Beta-User value: “true” backendRefs: – name: payments-service-beta port: 8080 – matches: – path: type: PathPrefix value: /payments backendRefs: – name: payments-service port: 8080 Cross-namespace routing — the Gateway lives in infra, HTTPRoutes live in team namespaces — solves the governance problem that annotations can’t: the platform team controls load balancer configuration, application teams control routing rules, and neither can modify the other’s objects. The AWS Load Balancer Controller supports Gateway API from v2.5 onward. For new clusters being set up today, Gateway API is the right choice for anything beyond simple single-team Ingress. For existing clusters, the migration path is incremental — the LBC supports both simultaneously. Decision matrix: Scenario Recommendation Simple single-team HTTP routing Ingress with LBC Multiple teams sharing one ALB Gateway API (HTTPRoute per team) Canary or weighted traffic splitting Gateway API Header-based or query-based routing Gateway API TCP/UDP passthrough (non-HTTP) NLB with Service type:LoadBalancer Source IP preservation required IP mode (either Ingress or Gateway API) ALB in front of non-Kubernetes backends Ingress or Gateway API with cross-namespace refs What you see: Intermittent connection failures between specific pods on different nodes. tcpdump on the sending pod shows packets leaving. The receiving pod never sees them. No RST, no ICMP unreachable. Connections time out after 30–120 seconds depending on the application’s TCP timeout. What’s actually happening: A pod’s traffic is exiting through the wrong ENI. The policy routing rule that maps the pod’s source IP to its ENI’s routing table is missing or points to the wrong table. The packet exits via the node’s primary ENI (eth0), but the pod’s IP belongs to a secondary ENI (eth1). The VPC sees a packet sourced from an IP that doesn’t belong to eth0’s ENI attachment and drops it silently. Post 1 covered this as a consequence of ipamd crashing mid-allocation. At the cross-node level, the same root cause produces failures that are harder to catch because they’re intermittent — only traffic from the affected pod shows the problem, and the failure mode looks identical to network policy blocks, security group restrictions, and application-level timeouts. # SSH to the sending node # Check that every pod IP has a policy routing rule ip rule list | sort -k7 -n # For every pod on this node, there should be an entry: # 1024: from # If a pod IP is absent, its traffic falls to the default table # and exits via the wrong ENI. # For each pod IP, verify the rule points to the right table # and that table exits via the ENI that owns the IP ip route show table 101 # default via 10.0.1.1 dev eth0 ← correct if pod IP is on eth0’s pool # Cross-check: which ENI owns this pod IP? aws ec2 describe-network-interfaces \ –filters “Name=addresses.private-ip-address,Values=10.0.1.11” \ –query ‘NetworkInterfaces[*].{ENI:NetworkInterfaceId,Device:Attachment.DeviceIndex}’ \ –output json # If DeviceIndex is 1 (eth1), the routing table should exit via eth1 # If it exits via eth0, you have the asymmetric routing problem Fix: delete the affected pod. The CNI plugin re-runs ADD, which reinstalls the correct policy routing rule. Alert on ipamd restarts — every restart is a window where this race condition can occur. What you see: During a rolling deployment, a small percentage of requests return 502 or connection reset errors. The errors are not reproducible — they appear for 10–30 seconds during the deployment window and then stop. The new version is healthy. What’s actually happening: iptables rule propagation and pod termination are not synchronized. When a pod enters Terminating state, three things happen in parallel: the pod receives SIGTERM, the endpoint controller removes the pod from the Service’s endpoints, and kube-proxy receives the endpoint deletion event and rewrites the iptables rules to remove that pod as a target. The iptables rewrite takes time — 1–5 seconds on a large cluster. For that window, kube-proxy is still sending new connections to the terminating pod. The pod’s application may have already stopped accepting connections. New connections fail. The correct fix uses two knobs together: # In your Deployment’s pod spec: spec: containers: – name: app lifecycle: preStop: exec: command: [“/bin/sh”, “-c”, “sleep 5”] # Wait for iptables propagation terminationGracePeriodSeconds: 30 # Grace period > preStop sleep The preStop sleep gives kube-proxy time to propagate the endpoint removal before the application stops accepting connections. The pod stays in service during the sleep, draining in-flight requests. After the sleep, SIGTERM fires, the application shuts down gracefully, and by that point no new connections are being sent to it. The specific sleep duration depends on your cluster size and kube-proxy configuration — 5 seconds covers most clusters up to 1,000 nodes. In IPVS mode or with eBPF, endpoint propagation is faster and 2 seconds is typically sufficient. What you see: Your application’s access logs show node IPs (10.0.x.x from your VPC) instead of client IPs. Rate limiting based on source IP breaks — every client appears as the same node IP. Geo-restriction logic fails entirely. What’s actually happening: In ALB instance mode, traffic arrives at the node from the ALB, and the node performs SNAT before forwarding to the pod. The pod sees the node’s IP as the source. The real client IP is in the X-Forwarded-For header, but only if the application explicitly reads it — and many frameworks don’t by default. The three solutions, in order of preference: Option 1 — Switch to IP mode. The ALB routes directly to pod IPs. No SNAT at the node. The pod still sees the ALB’s IP as the source (the ALB terminates TCP), but X-Forwarded-For contains the real client IP and there’s no node SNAT adding noise. Option 2 — externalTrafficPolicy: Local in instance mode. No cross-node forwarding means no SNAT. The node forwards directly to a local pod without rewriting the source. The pod sees the ALB’s IP. Works without switching to IP mode, but distributes load unevenly. Option 3 — Proxy Protocol v2. Configure the ALB to send Proxy Protocol v2 headers with the connection. The pod receives a binary header at the start of each TCP connection containing the original client IP and port. Requires the application (or its load balancing library) to parse PP2 headers — nginx and envoy support this natively; most application frameworks need explicit configuration. # Enable Proxy Protocol v2 in LBC annotations annotations: alb.ingress.kubernetes.io/target-type: ip alb.ingress.kubernetes.io/target-group-attributes: > proxy_protocol_v2.enabled=true # nginx.conf — parse Proxy Protocol on the upstream server { listen 8080 proxy_protocol; real_ip_header proxy_protocol; set_real_ip_from 0.0.0.0/0; } What you see: New pods come up, pass their readiness probe, show Ready in kubectl get pods. But for the next 30–60 seconds they receive no traffic from the ALB. During a rolling deployment this means reduced capacity for a full minute per batch of new pods. What’s actually happening: The ALB controller must call the ELBv2 API to register new pod IPs as targets. This call is not instantaneous — it involves the LBC detecting the endpoint change, queuing an API call, and the ALB completing the registration and initial health check. The default health check interval is 30 seconds. A new target must pass a configurable number of health checks (default: 5 successes) before receiving traffic. With default settings, a new pod waits 2.5 minutes before the ALB sends it traffic. # Check current health check configuration aws elbv2 describe-target-groups \ –query ‘TargetGroups[*].{Name:TargetGroupName,Interval:HealthCheckIntervalSeconds,Threshold:HealthyThresholdCount}’ \ –output table # For faster registration during deployments, reduce these: annotations: alb.ingress.kubernetes.io/healthcheck-interval-seconds: “10” # down from 30 alb.ingress.kubernetes.io/healthy-threshold-count: “2” # down from 5 # New pods are eligible for traffic in ~20 seconds instead of ~150 For the deregistration side — traffic to terminating pods — set a deregistration delay that gives in-flight connections time to complete: annotations: alb.ingress.kubernetes.io/target-group-attributes: > deregistration_delay.timeout_seconds=30 This holds connections open to deregistering targets for 30 seconds. Combine with the preStop sleep from Pattern 2 for clean rolling deploys: the preStop prevents new connections from reaching the terminating pod while the deregistration delay drains the ones already in flight. Prerequisites: EKS cluster with at least two nodes, kubectl and awscli configured, SSM access to nodes. # Deploy two pods, one per node, to use as endpoints kubectl apply -f – < apiVersion: v1 kind: Pod metadata: name: pod-a labels: app: capture-test spec: nodeName: $(kubectl get nodes -o name | head -1 | cut -d/ -f2) containers: – name: app image: public.ecr.aws/amazonlinux/amazonlinux:2 command: [“python3”, “-m”, “http.server”, “8080”] — apiVersion: v1 kind: Pod metadata: name: pod-b spec: nodeName: $(kubectl get nodes -o name | tail -1 | cut -d/ -f2) containers: – name: app image: public.ecr.aws/amazonlinux/amazonlinux:2 command: [“python3”, “-m”, “http.server”, “8080”] EOF # Get IPs POD_A=$(kubectl get pod pod-a -o jsonpath='{.status.podIP}’) POD_B=$(kubectl get pod pod-b -o jsonpath='{.status.podIP}’) echo “Pod A: $POD_A, Pod B: $POD_B” # Get node instance IDs INSTANCE_A=$(kubectl get pod pod-a -o jsonpath='{.spec.nodeName}’ | \ xargs -I{} kubectl get node {} -o jsonpath='{.spec.providerID}’ | cut -d/ -f5) INSTANCE_B=$(kubectl get pod pod-b -o jsonpath='{.spec.nodeName}’ | \ xargs -I{} kubectl get node {} -o jsonpath='{.spec.providerID}’ | cut -d/ -f5) # Start captures on both nodes (run these in separate terminals simultaneously) # Terminal A: aws ssm start-session –target $INSTANCE_A \ –document-name AWS-StartInteractiveCommand \ –parameters command=”sudo tcpdump -i any -n ‘host $POD_A and host $POD_B’ -v” # Terminal B: aws ssm start-session –target $INSTANCE_B \ –document-name AWS-StartInteractiveCommand \ –parameters command=”sudo tcpdump -i any -n ‘host $POD_A and host $POD_B’ -v” # Terminal C — generate traffic kubectl exec pod-a — curl -s http://$POD_B:8080/ In both capture windows you’ll see packets with source $POD_A, destination $POD_B. No VXLAN wrapper. No outer IP header. The IP you see in the VPC routing is the IP the pod sent. # Count current rules sudo iptables -t nat -L | wc -l # Deploy 100 services for i in $(seq 1 100); do kubectl create service clusterip test-svc-$i –tcp=80:80 done # Count again sudo iptables -t nat -L | wc -l # Expect ~2,000 more rules # Deploy 400 more (500 total) for i in $(seq 101 500); do kubectl create service clusterip test-svc-$i –tcp=80:80 done sudo iptables -t nat -L | wc -l # The growth is linear. Plot services vs rules for your own cluster. # Measure rule update time during a rolling deploy (approximation) time sudo iptables-save > /dev/null # This simulates the read side of the lock acquisition kube-proxy uses. # Clean up for i in $(seq 1 500); do kubectl delete service test-svc-$i –wait=false done # Load kernel modules on each node (run via SSM on all nodes) sudo modprobe ip_vs ip_vs_rr ip_vs_wrr ip_vs_sh nf_conntrack # Switch kube-proxy to IPVS mode kubectl get configmap kube-proxy -n kube-system -o yaml > kube-proxy-config.yaml # Edit: mode: “ipvs” kubectl apply -f kube-proxy-config.yaml kubectl rollout restart daemonset kube-proxy -n kube-system kubectl rollout status daemonset kube-proxy -n kube-system # Verify on a node aws ssm start-session –target $INSTANCE_A \ –document-name AWS-StartInteractiveCommand \ –parameters command=”sudo ipvsadm -Ln | head -30″ # The iptables KUBE-SERVICES chain is now empty aws ssm start-session –target $INSTANCE_A \ –document-name AWS-StartInteractiveCommand \ –parameters command=”sudo iptables -t nat -L KUBE-SERVICES -n | wc -l” # 3 (header lines only — no service rules) # Redeploy your 500 test services and recount # ipvsadm entries: one per service (O(1) lookup, not O(n) chain) aws ssm start-session –target $INSTANCE_A \ –document-name AWS-StartInteractiveCommand \ –parameters command=”sudo ipvsadm -Ln | grep -c ‘^TCP'” # Deploy the same service in both modes using two separate Ingress objects kubectl apply -f – < apiVersion: apps/v1 kind: Deployment metadata: name: echo-app spec: replicas: 3 selector: matchLabels: app: echo template: metadata: labels: app: echo spec: containers: – name: echo image: public.ecr.aws/amazonlinux/amazonlinux:2 command: [“python3”, “-m”, “http.server”, “8080”] ports: – containerPort: 8080 — apiVersion: v1 kind: Service metadata: name: echo-ip-mode spec: selector: app: echo ports: – port: 80 targetPort: 8080 — apiVersion: networking.k8s.io/v1 kind: Ingress metadata: name: echo-ip-mode annotations: kubernetes.io/ingress.class: alb alb.ingress.kubernetes.io/scheme: internet-facing alb.ingress.kubernetes.io/target-type: ip # IP mode alb.ingress.kubernetes.io/healthcheck-path: / spec: rules: – http: paths: – path: / pathType: Prefix backend: service: name: echo-ip-mode port: number: 80 — apiVersion: networking.k8s.io/v1 kind: Ingress metadata: name: echo-instance-mode annotations: kubernetes.io/ingress.class: alb alb.ingress.kubernetes.io/scheme: internet-facing alb.ingress.kubernetes.io/target-type: instance # Instance mode alb.ingress.kubernetes.io/healthcheck-path: / spec: rules: – http: paths: – path: / pathType: Prefix backend: service: name: echo-ip-mode port: number: 80 EOF # Wait for ALBs to provision (2-3 minutes) kubectl get ingress -w # Test both and observe where the request comes from ALB_IP=$(kubectl get ingress echo-ip-mode \ -o jsonpath='{.status.loadBalancer.ingress[0].hostname}’) ALB_INSTANCE=$(kubectl get ingress echo-instance-mode \ -o jsonpath='{.status.loadBalancer.ingress[0].hostname}’) # In IP mode — capture on a pod to see what source IP it receives kubectl exec $(kubectl get pod -l app=echo -o name | head -1) — \ tcpdump -i eth0 -n ‘tcp port 8080’ -c 10 # Send traffic through both ALBs for i in $(seq 1 5); do curl -s http://$ALB_IP/ > /dev/null; done for i in $(seq 1 5); do curl -s http://$ALB_INSTANCE/ > /dev/null; done # In IP mode: source is the ALB’s IP (no node SNAT in the path) # In instance mode: source is the node’s IP (SNAT applied at the node) A packet can now travel from pod to pod across nodes, survive a Service DNAT, and arrive from an ALB in either of two fundamentally different modes. You have the mental model for every segment of the data path and the debugging primitives to observe each one directly. The VPC CNI’s real-IP model is what makes most of this work. IP mode ALBs, Flow Log visibility, the absence of encapsulation overhead — all of it depends on pods having real VPC addresses. That dependency runs in both directions: the features are stronger, but the IP pressure from Post 1 is the price. kube-proxy’s iptables model works at small scale and breaks at large scale in ways that are hard to predict from the outside. The linear rule traversal and the global lock are real constraints, not theoretical ones. IPVS solves both with minimal operational change. eBPF eliminates the service translation layer entirely, at the cost of a more specialized operational model. The ALB’s two modes aren’t just an annotation choice — they’re different dataplanes with different properties for source IP, extra hops, and connection draining. IP mode is almost always preferable for new deployments, and the security group requirement (the ALB must be able to reach pod IPs directly) is the only meaningful friction. The packet can travel. It can reach services. It can come in from the load balancer. The next question is which packets are allowed to flow at all. Post 3 covers network policy — Kubernetes NetworkPolicy, Security Groups for Pods, and what each one actually enforces at the kernel level. We’ll deploy a policy that accidentally blocks DNS and watch service discovery fail in slow motion across an entire cluster. We’ll walk through how the CNI plugin enforces NetworkPolicy rules, why a missing egress rule is the most common policy mistake in production, and how Security Groups for Pods gives you AWS-native enforcement at pod granularity without modifying iptables at all. Next: Post 3 — Network Policy and the Firewall You Didn’t Know You Had
Section 3 — eBPF and Cilium: when you remove kube-proxy entirely
What kube-proxy does that eBPF replaces
How it works: TC and sockops
Performance comparison
What you give up
Running Cilium alongside the VPC CNI
Section 4 — The ALB’s view of your cluster
Instance mode
IP mode
ALB controller mechanics
Gateway API
Section 5 — How this breaks in production
Pattern 1 — Asymmetric routing silent drop (cross-node variation)
Pattern 2 — In-flight connections to terminating pods
Pattern 3 — Source IP disappearing in instance mode
Pattern 4 — ALB IP mode target registration lag
Build: observe, understand, break, fix
Step 1 — Cross-node packet capture
Step 2 — iptables at scale
Step 3 — Switch to IPVS and compare
Step 4 — ALB IP mode vs instance mode comparison
What you now know — and what comes next

![]()