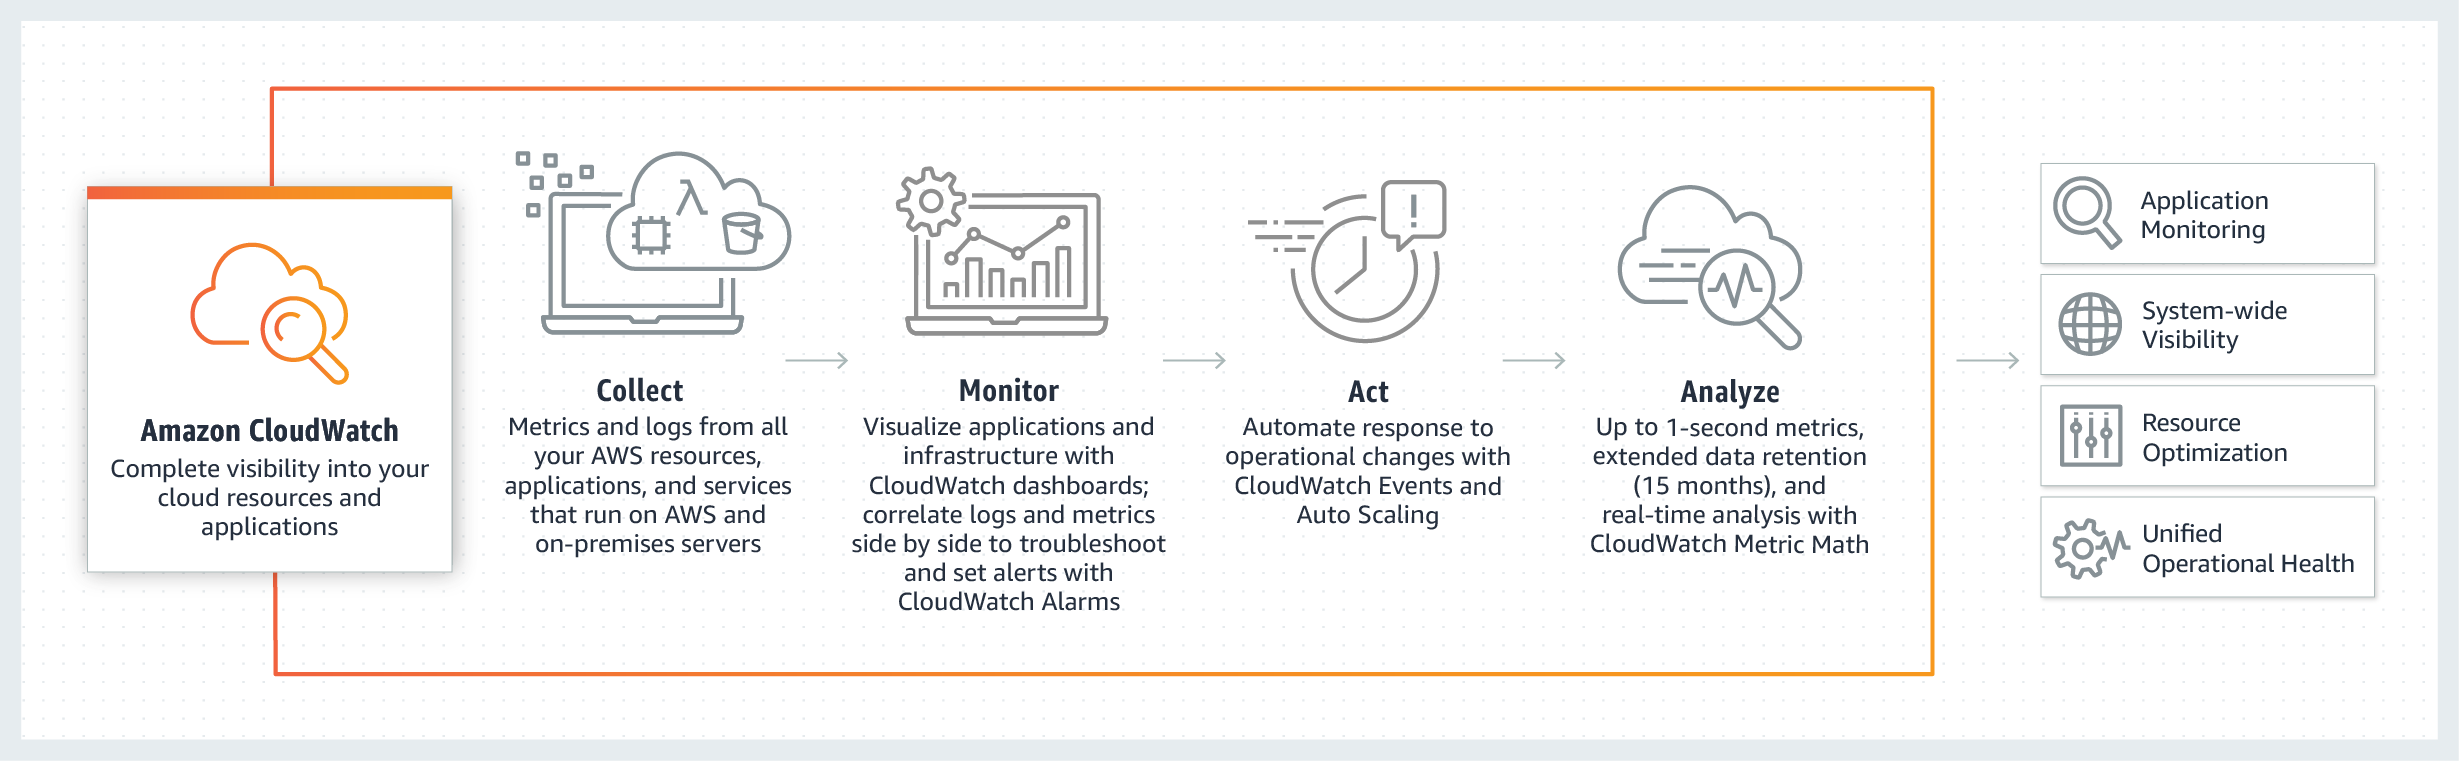
CloudWatch collects monitoring and operational data in the form of logs, metrics, and events, and visualizes it using automated dashboards so you can get a unified view of your AWS resources, applications, and services that run in AWS and on-premises.
Cloudwatch Metrics
Metric: A metric represents a time-ordered set of data points that are published to CloudWatch
Datapoint:
Definition: Variable to monitor: E.g. CPU Usage of a EC2 instance
Data points: The value of the variable at a specific point in time. Each metric data point must be associated with a timestamp
Namespace: A namespace is a container for CloudWatch metrics. Metrics in different namespaces are isolated from each other, so that metrics from different applications are not mistakenly aggregated into the same statistics.
Dimension : Dimensions are preset groupings of instances. Selecting a dimension will filter your metrics to isolate that particular group
Check the link for additional information: https://codeburst.io/amazon-cloudwatch-metrics-by-example-249826b1404d
Grouping: Metrics are grouped first by namespace, and then by the various dimension combinations within each namespace. For example, you can view all EC2 metrics, EC2 metrics grouped by instance, or EC2 metrics grouped by Auto Scaling group.
Resolution: Each metric is one of the following
Standard resolution, with data having a one-minute granularity
High resolution, with data at a granularity of one second
Statistics: Statistics are metric data aggregations over specified periods of time.
Example : Min, Max, average, Sum, Percentice PNN.NN
Dashboards
Amazon CloudWatch dashboards are customizable home pages in the CloudWatch console that you can use to monitor your resources in a single view, even those resources that are spread across different Regions
All dashboards are global, not Region-specific.
Widget: A GUI element that displays metrics. Dashboard, usually, contains 2 or more widgets.
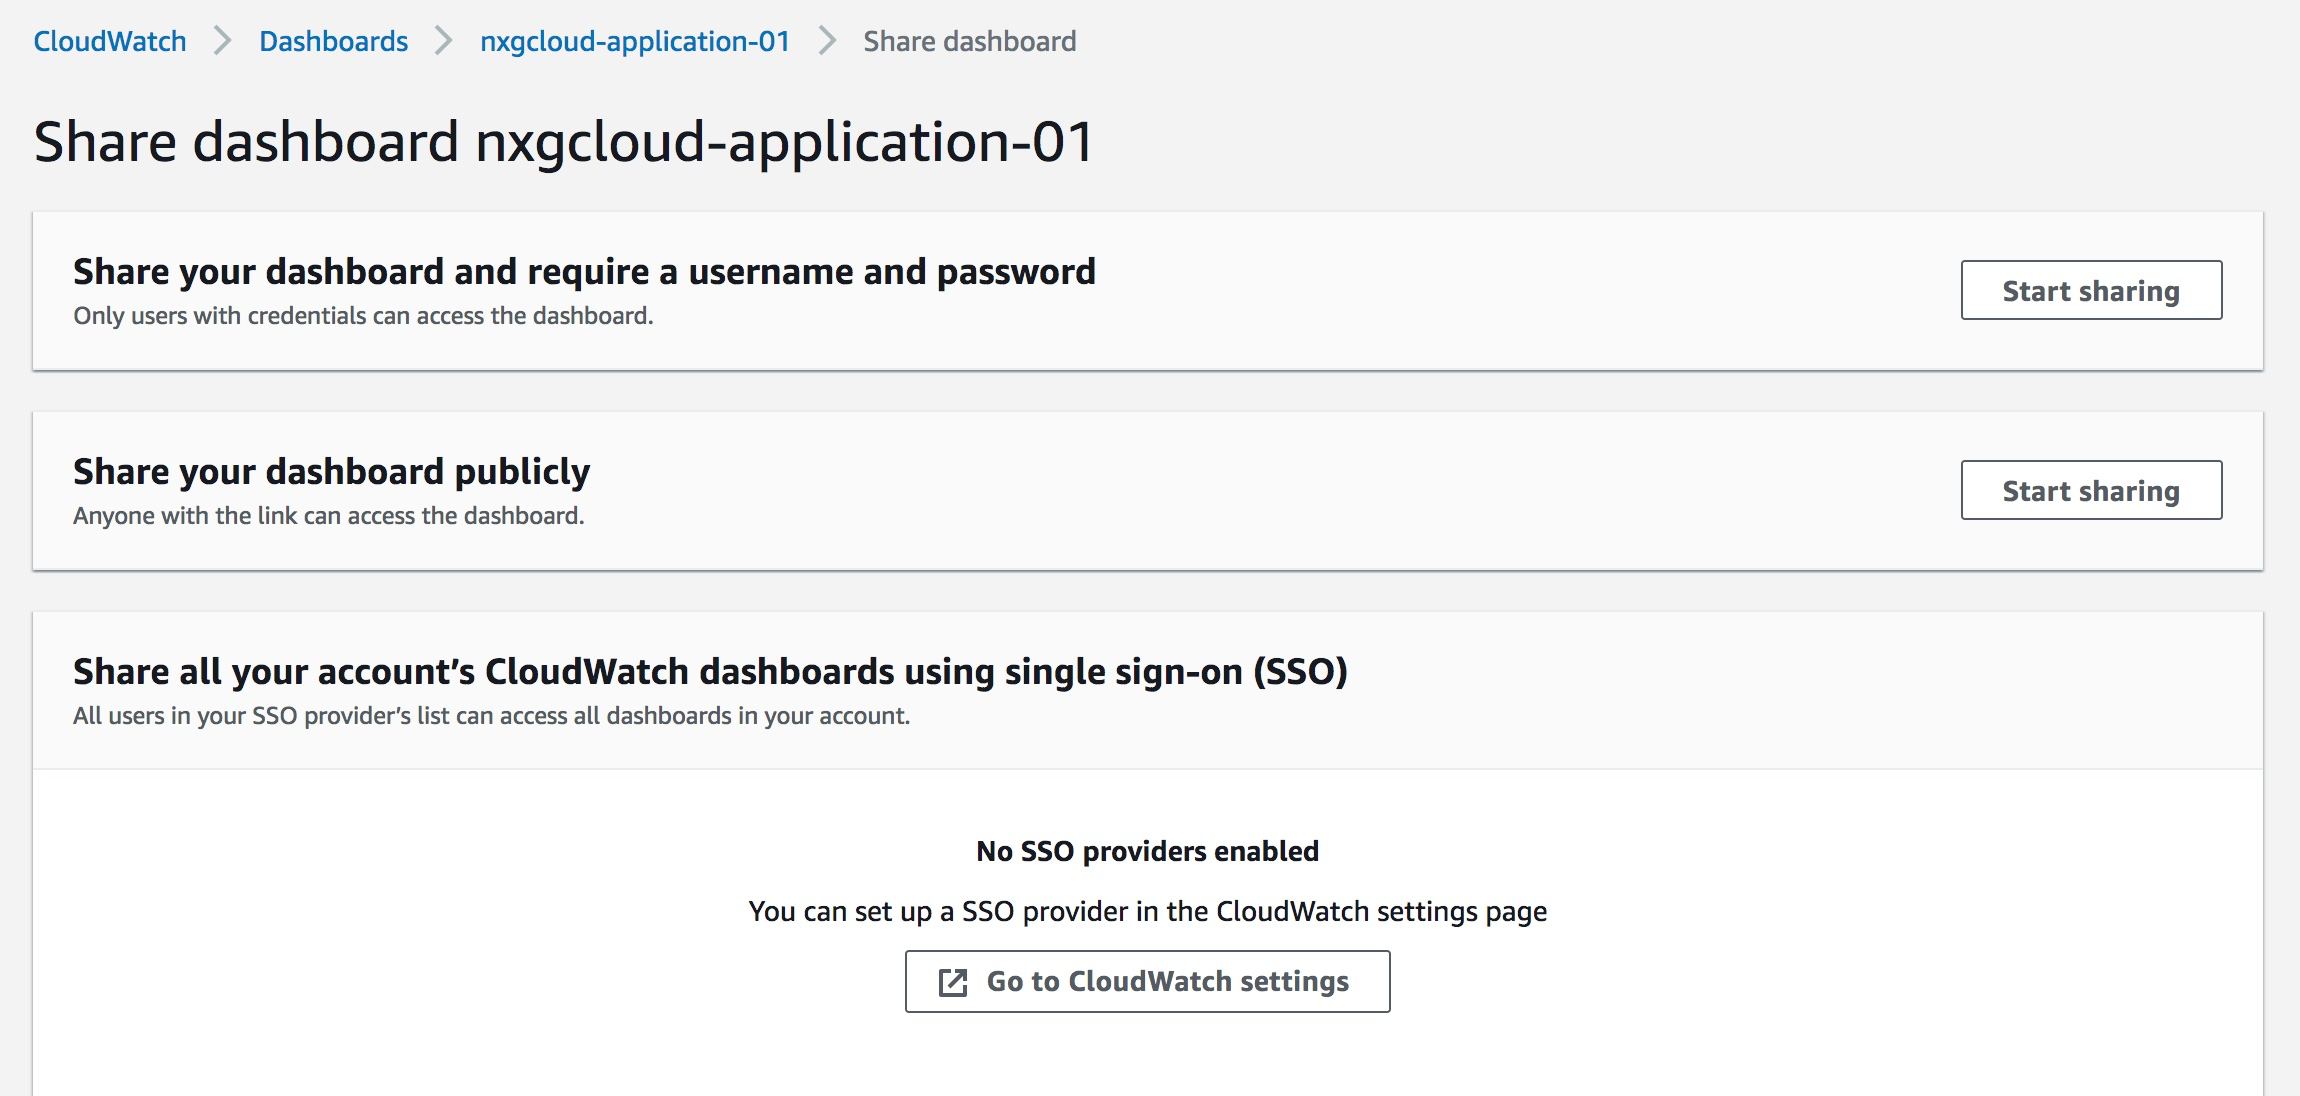
Sharing dashboards
Specific users : Share a single dashboard and designate specific email addresses of the people who can view the dashboard.
Share publicly: Share a single dashboard publicly, so that anyone who has the link can view the dashboard.
Share to sso users: Share all the CloudWatch dashboards in your account and specify a third-party single sign-on (SSO) provider for dashboard access. All users who are members of this SSO provider’s list can access all the dashboards in the account.
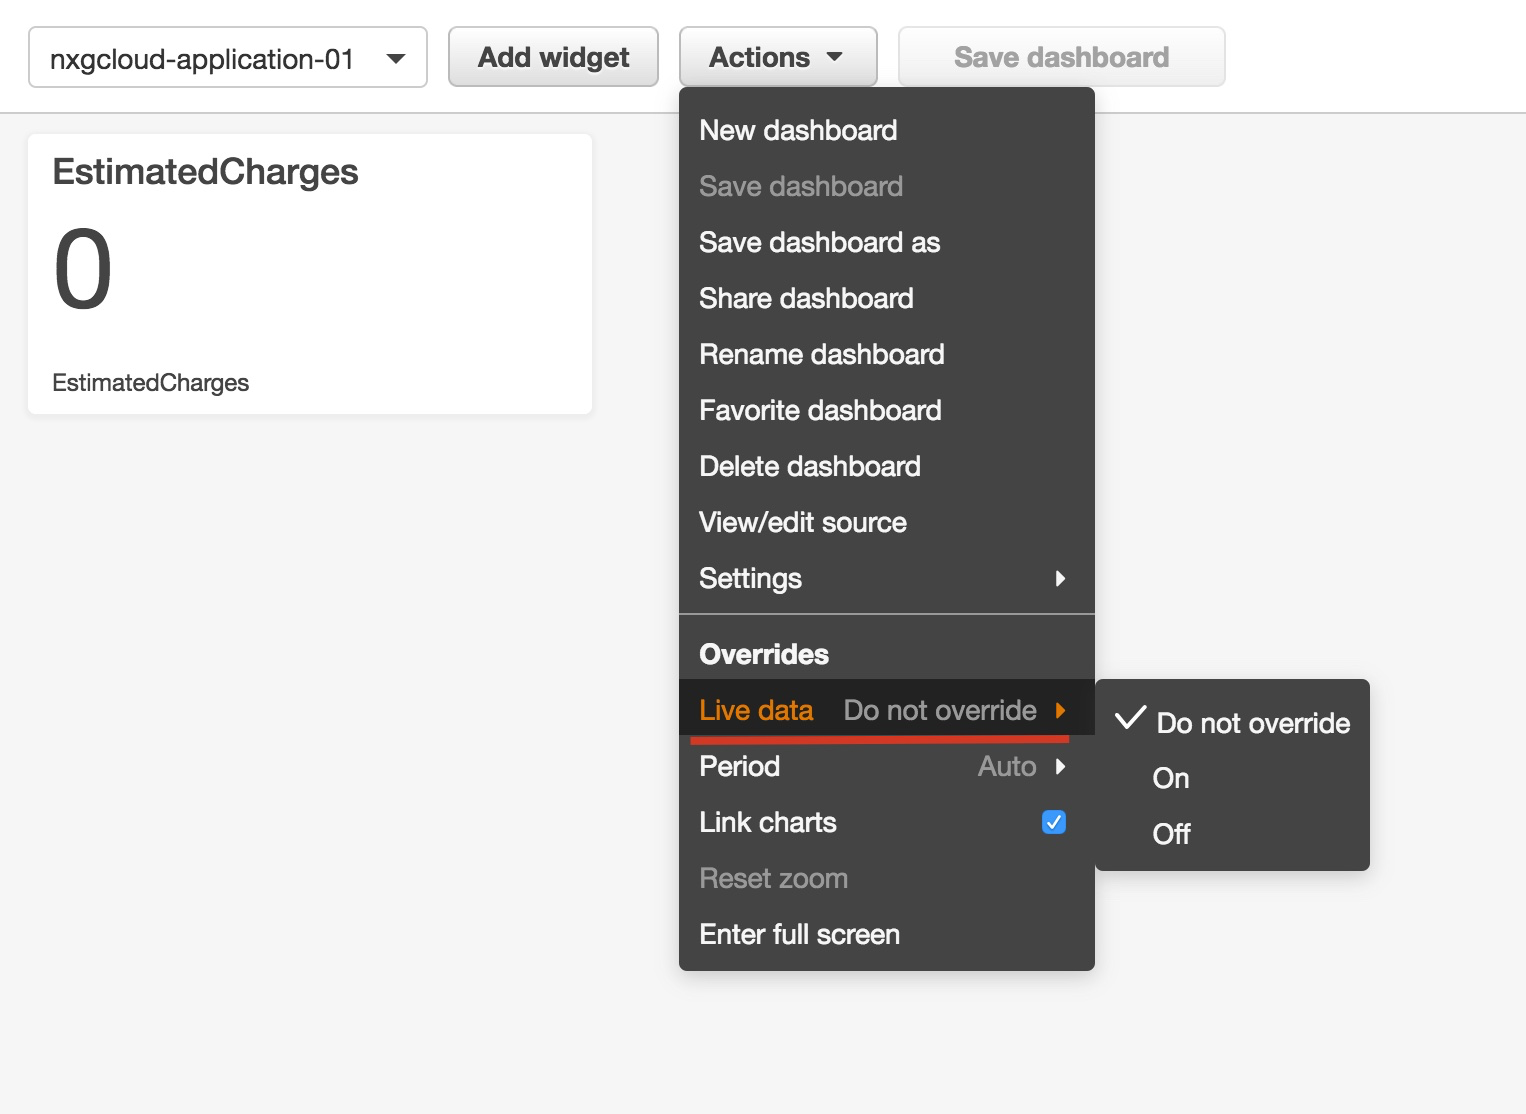
Live data: You can choose whether your metric widgets display live data. Live data is data published within the last minute that has not been fully aggregated.
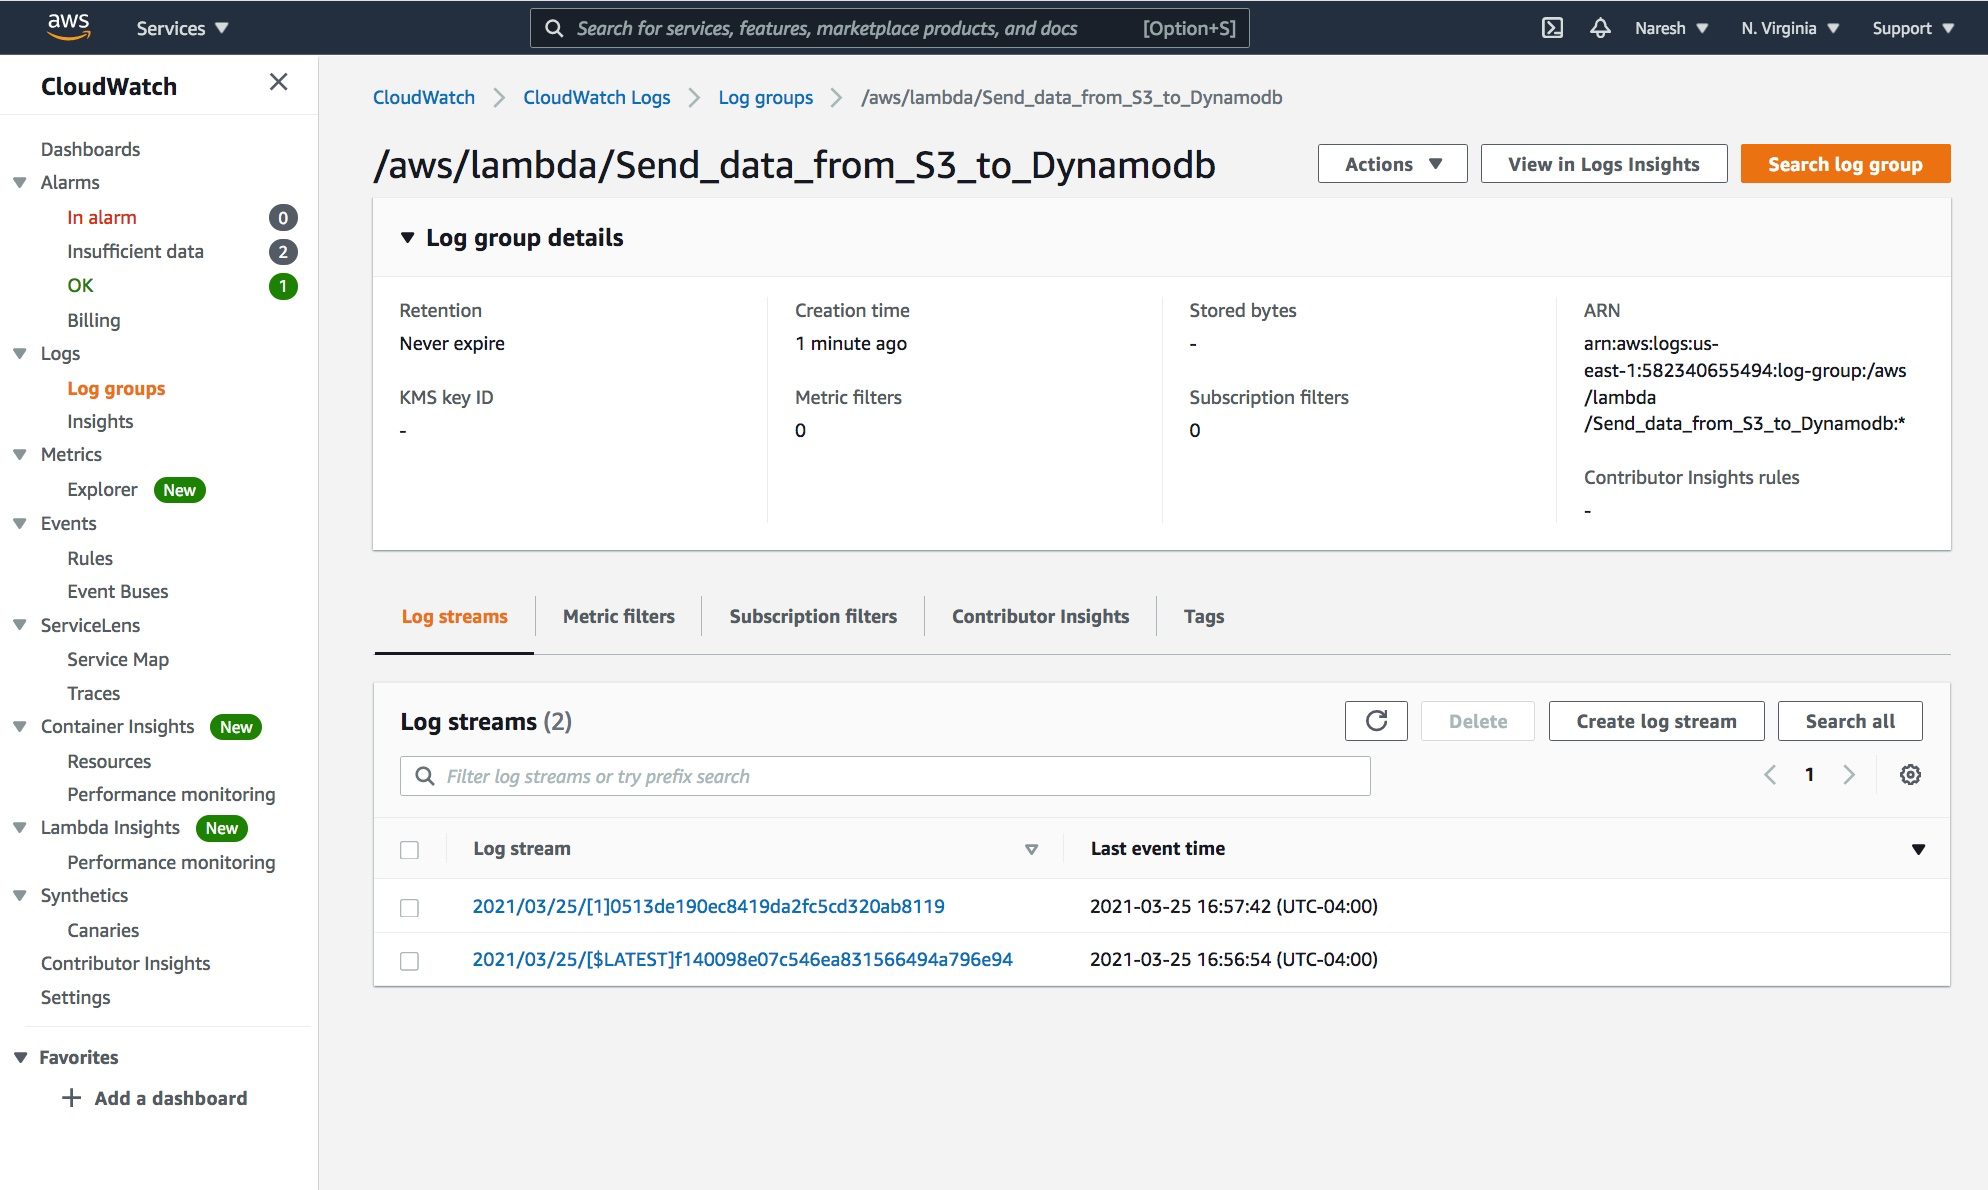
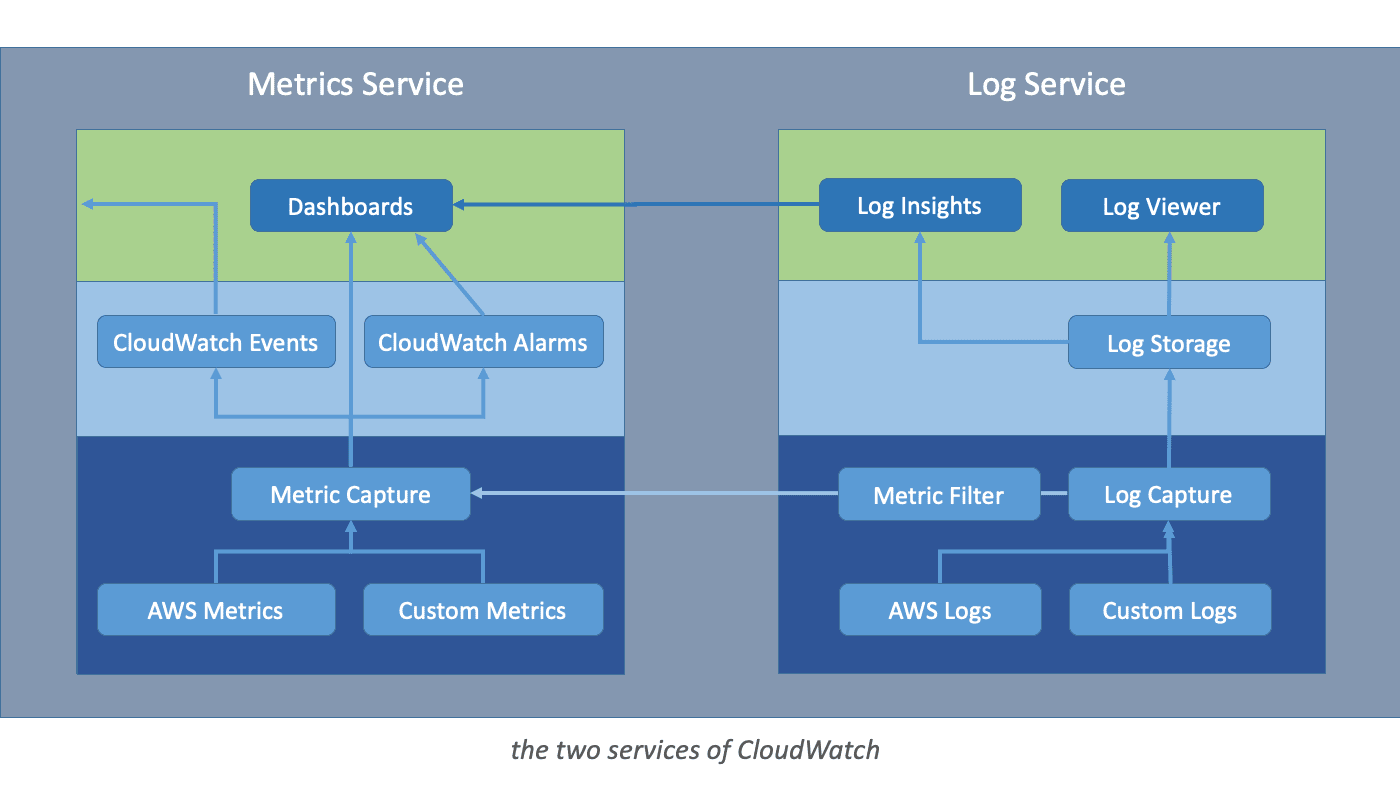
Cloudwatch logs
You can use Amazon CloudWatch Logs to monitor, store, and access your log files from Amazon Elastic Compute Cloud (Amazon EC2) instances, AWS CloudTrail, Route 53, and other sources.
Log event: A log event is a record of some activity recorded by the application or resource being monitored.
Log event contains
Timestamp
Event message
Log stream: A log stream is a sequence of log events that share the same source. Example: Log stream for a lambda run.
Log group: Log groups define groups of log streams that share the same retention, monitoring, and access control settings. Example a log group for a lambda.
Retention settings: Retention settings can be used to specify how long log events are kept in CloudWatch Logs. Expired log events get deleted automatically.
Metric filter: You can use metric filters to extract metric observations from ingested events and transform them to data points in a CloudWatch metric.
Reference and image credit: https://www.sensedeep.com/blog/posts/stories/what-is-cloudwatch.html . This is an excellent blogpost from sensedeep.
Subscriptions: You can use subscriptions to get access to a real-time feed of log events from CloudWatch Logs and have it delivered to other services such as an Amazon Kinesis stream, an Amazon Kinesis Data Firehose stream, or AWS Lambda for custom processing, analysis, or loading to other systems.